
Introduction
In Excel, you can perform descriptive and inferential statistics in various ways, and these methods have advantages and disadvantages. In this short article, I will introduce you to a technique you can use when you want to perform quick statistical calculations on a dataset.
Summary Statistics
Summary statistics are a subset of descriptive statistics that summarize and convey the crux of information about a sample data set. Some examples are the mean, standard error, median, mode, standard deviation, sample variance, kurtosis, skewness, range, minimum, maximum, sum, and count.
Most Excel users are accustomed to calculating these data individually. However, Excel offers a menu that delivers all descriptive statistics information at once—on the same page. Let us have a look.
The Data Analysis Command Tool
The data analysis command is accessible via the Data menu in the ribbon.

When you click on it, the Data commands listed below are displayed.

The data analysis command tool can be found in the upper left corner:

You won't see it unless you're in the Data tab or menu.
Why am I unable to see the Data Analysis Command?
If you don't see the data analysis command, it's most likely because you've never used it and hence haven't activated it. To activate your Data Analysis command, follow the steps below.
1. Go to the File menu or tab in your ribbon

When you open it, it will look like this:

Because I'm using Office 2019, your screen may look different if you use an older version.
2. Navigate to the options menu. It's the last item on the left-hand list of vertical menus. Select More if it isn't visible. Then make your selection.


3. In the left pane, select Add-ins.

4. Select Excel Add-ins from the drop-down menu, then click Go.

5. A new window will appear:
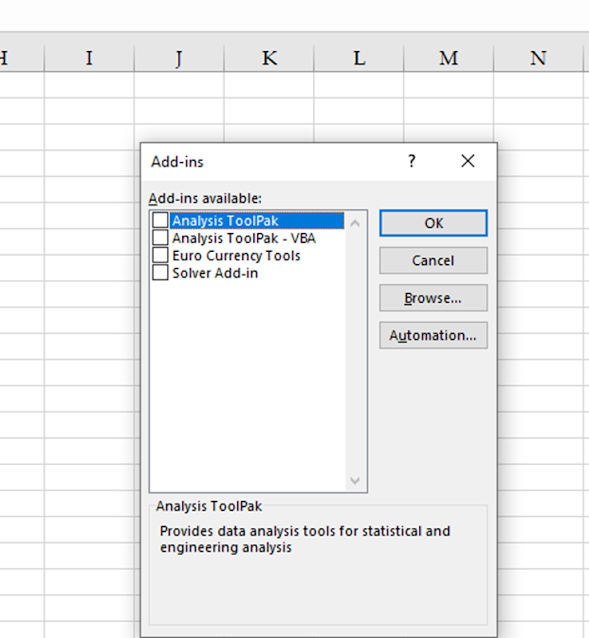
6. Tick all of the boxes as indicated below.

7. Wait a few minutes after clicking OK.
8. Return to the Data Analysis tab and locate your Data Analysis command at the far right end of the ribbon.

DOING SUMMARY STATISTICS
1. Prepare your data. For instance:

This data is information about the heights of pupils in a class.
2. Go to the Data tab and then data analysis.
A window appears as follows:

3. Select Descriptive Statistics, and then click OK.
4. A new window appears:


5. Place the cursor in the rectangular box for the input Range, then move to select the entire data set, including the heading. This is accomplished by clicking on the cell containing the title (for example, height) and dragging it to the end of the data.

6. Check the boxes for Labels in First Row and Summary Statistics as displayed.

7. Click Ok. It will redirect you to a new sheet containing the results.

8. You may choose to increase column widths for clarity.

CORRELATION
1. Prepare your data.
a. Correlation data is a paired dataset (x, y).
b. The independent variable, x, must be listed first, followed by the dependent variable, y.

2. Navigate to Data, then data analysis
3. Select Correlation


4. Select the data set, including the headings/labels for the Input Range.
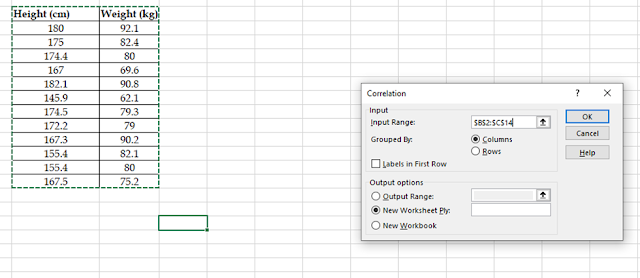
5. Check the First Row Labels, then click the OK button.

6. The output is displayed on a fresh sheet. Modify the column containing the cells for improved viewing:

CONCLUSION
The Data Analysis command includes descriptive and inferential statistics options. Regressions, ANOVA, chi-square, etc., can be conducted using the same procedures.
ABOUT THE AUTHOR

Michael Dabi is a professionally trained Environmental Scientist and Biological Oceanographer. He enjoys clarifying complex research and statistical concepts for student comprehension through writing.
Comments
+1 is added to my IT knowledge through this tutorial.
Well done.