HOW TO DO DESCRIPTIVE AND INFERENTIAL STATISTICS IN MICROSOFT EXCEL - PART ONE


Introduction

        In Excel, you can perform descriptive and inferential statistics in various ways, and these methods have advantages and disadvantages. In this short article, I will introduce you to a technique you can use when you want to perform quick statistical calculations on a dataset. 


Summary Statistics

        Summary statistics are a subset of descriptive statistics that summarize and convey the crux of information about a sample data set. Some examples are the mean, standard error, median, mode, standard deviation, sample variance, kurtosis, skewness, range, minimum, maximum, sum, and count. 

        Most Excel users are accustomed to calculating these data individually. However, Excel offers a menu that delivers all descriptive statistics information at once—on the same page. Let us have a look. 


The Data Analysis Command Tool

        The data analysis command is accessible via the Data menu in the ribbon. 


When you click on it, the Data commands listed below are displayed. 


The data analysis command tool can be found in the upper left corner: 


You won't see it unless you're in the Data tab or menu. 


Why am I unable to see the Data Analysis Command? 

        If you don't see the data analysis command, it's most likely because you've never used it and hence haven't activated it. To activate your Data Analysis command, follow the steps below. 

1. Go to the File menu or tab in your ribbon 


When you open it, it will look like this: 


         Because I'm using Office 2019, your screen may look different if you use an older version. 


2. Navigate to the options menu. It's the last item on the left-hand list of vertical menus. Select More if it isn't visible. Then make your selection. 


3. In the left pane, select Add-ins. 


4. Select Excel Add-ins from the drop-down menu, then click Go. 


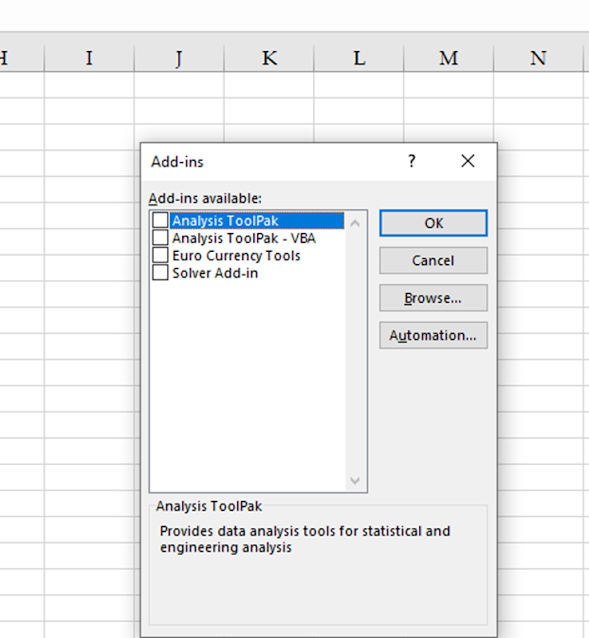
5. A new window will appear: 


6. Tick all of the boxes as indicated below. 


7. Wait a few minutes after clicking OK. 

8. Return to the Data Analysis tab and locate your Data Analysis command at the far right end of the ribbon. 


DOING SUMMARY STATISTICS

1. Prepare your data. For instance: 


        This data is information about the heights of pupils in a class. 

2. Go to the Data tab and then data analysis. 

A window appears as follows: 


 3. Select Descriptive Statistics, and then click OK. 

4. A new window appears: 


5. Place the cursor in the rectangular box for the input Range, then move to select the entire data set, including the heading. This is accomplished by clicking on the cell containing the title (for example, height) and dragging it to the end of the data. 


6. Check the boxes for Labels in First Row and Summary Statistics as displayed. 


7. Click Ok. It will redirect you to a new sheet containing the results. 


 8. You may choose to increase column widths for clarity. 


CORRELATION 

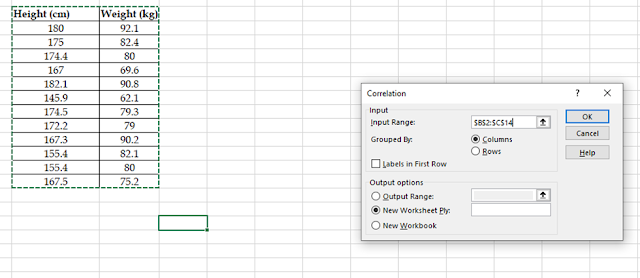
1. Prepare your data. 

    a. Correlation data is a paired dataset (x, y).

    b. The independent variable, x, must be listed first, followed by the             dependent variable, y. 


2. Navigate to Data, then data analysis 

3. Select Correlation 


4. Select the data set, including the headings/labels for the Input Range. 


5. Check the First Row Labels, then click the OK button. 


6. The output is displayed on a fresh sheet. Modify the column containing the cells for improved viewing: 


CONCLUSION

        The Data Analysis command includes descriptive and inferential statistics options. Regressions, ANOVA, chi-square, etc., can be conducted using the same procedures. 


ABOUT THE AUTHOR


Michael Dabi is a professionally trained Environmental Scientist and Biological Oceanographer. He enjoys clarifying complex research and statistical concepts for student comprehension through writing.


Comments

Anonymous said…
Biometry chronicles 🙂🙂🙂
M&P SOLUTIONS. said…
Steps are very simple to follow.
+1 is added to my IT knowledge through this tutorial.
Well done.
Anonymous said…
Thank u sir, pls in the pervious link. Had wanted to ask about regression variable. Is it a type of research. If u can stress alittle on it, I would be grateful. Thank u
Anonymous said…
Regression is a statistical tool used for analysis in research. It is not particularly a type of research. As a statistical tool, it can be used to establish the relationship between the dependent variable and one or more independent variables. It can also be used to estimate or predict the dependent variable yielding from the combination of one or more independent variables. I am not as expert, I believe Sir will elaborate further on this. Thank you
Author said…
Thanks for the reply. The question has been duly answered.
I'm Loving it already. Simple and Straightforward. Thanks very much for the education.
What a simple way of learning? Thank you Sir

Popular posts from this blog

CREATING ONLINE QUESTIONNAIRES USING GOOGLE FORMS

  Introduction Google forms can be used for a variety of purposes. In a recent blog, I demonstrated how to utilize Google Forms to create simple survey questions. In this article, I'll show you how to utilize Google Forms to create and distribute research questionnaires. The post would also go on to demonstrate how to export the data into Microsoft Excel.  Getting Started To get started, you must first develop and finalize your questionnaire. It is not a good idea to write your questions directly into Google Forms—it increases error.           This tutorial would make use of a PC. It is preferable to perform such exercises on a computer rather than a phone.  1. Go to www.forms.google.com  Your interface should look like this.    2. As seen above, click "start new form." This should take you to the following page:    3. Click on one of the "untitled forms" placeholders, clear the text, and type or copy and paste ...

Introduction to Research Designs

  By Michael Dabi  Introduction In academic inquiry, the terms research design, research methods, and research methodology are interconnected yet distinct concepts essential for shaping a research project. 1. Research Design: The Blueprint Research design represents the overarching blueprint or framework guiding the research endeavor. It defines the structure of the investigation and delineates how the research question will be approached. Examples of research designs include experimental design, survey design, case study design, and mixed methods design, each tailored to specific research objectives. 2. Research Methods: Practical Tools Research methods encompass the specific tools and techniques employed within the chosen research design to collect and analyze data. These methods vary depending on the research design and may include surveys, observations, document analysis, and focus groups. Table 1: Popular Research Methods Method Descriptio...

BUILDING ON HILLS: THE PERILOUS GAMBLE WITH NATURE

On the afternoon of Saturday, July 8, 2023, in the lovely township of Ho, nestled amidst the gorgeous hills of Ghana's Volta Region, a disastrous event occurred. A three-hour rainstorm turned the picturesque valley into a flooded environment, causing major property loss and structure damage. As a flood risk enthusiast and environmental scientist, I am profoundly concerned about the risks of constructing on hills. In this blog post, we will look at the risks, look at case studies, and talk about how local and national governments, as well as individuals, can react proactively to avoid disasters in the face of rapid population increase and urbanization.   The Risks of Building on Hills Due to the geological and hydrological characteristics of hillside terrain, there are inherent dangers associated with hillside construction. Among the principal threats are: Increased Flood Vulnerability Hills serve as natural drainage channels, directing rainwater downhill. As evidenced b...